

Profiling helps developers find out where a program is spending too much time in the execution, i.e., where some functions are taking too much memory in the execution. So, to do proper resource utilization, we need to remove or optimize the program or functions being used in the programs.

Profilers can be used to find bottlenecks in different areas, such as memory or time taken for code to execute. Python has some inbuilt profilers (cProfile, Profile) that can be introduced in the code to keep track of activities, such as how much is being used by the program, how many resources are being used, etc.
There are other tools available for profiling, but their use depends on the work and the organization, as organizations usually have some limitations on doing the profiling. These are some of the factors that help the organization choose a tool for profiling:
-
The amount of overhead the tool has in the production environment.
-
How the tools show the data
-
How the report is generated, and what are the different attributes that will be there in the report.
Let us discuss some tools and functions used in profiling:
 View Website
 View Website
 View Website
gProfiler
gProfiler is used for the profiling of Python code. It actually works differently from the tools defined above but is still free-to-use.
When you are profiling in Python, you need to download Python modules such cProfile or memory_profile. We need to install different packages to look at the various statistics of the code. Since they need to be included in the program, this creates a lot of hassle and complicates the code.
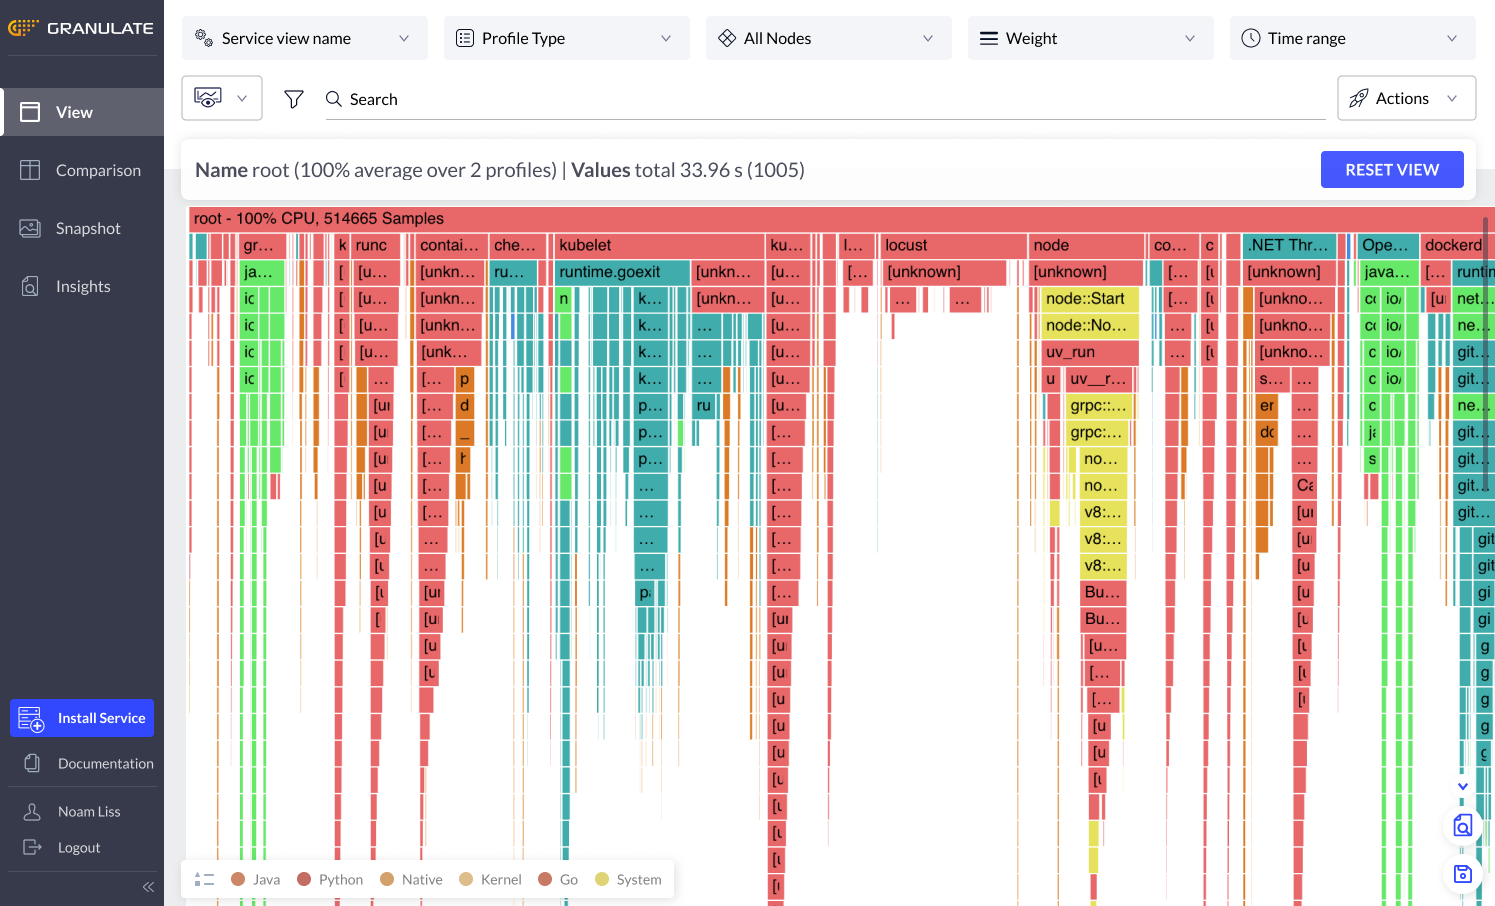
Most of the time, developers require a package or module to monitor the code in the production. gProfiler's plug and play feature means you can download and run the tool. It can easily be used in the production and won't take much memory. It also doesn't take up much CPU space and runs in the background, so it's very cost effective. After running the gProfiler, you need to execute it. Then each program running on the server will be profiled, and you will have a graph view. So you can easily modify the functions or the system calls that are taking more time and memory in the execution.
Line_profiler:
It is helpful for doing line-by-line profiling of the Python code and provides the time taken in the execution of each line of the program.
In some programs, the same code or function is used at multiple places. Developers want to understand at which place the optimization is needed. Cprofiler provides us the execution time of the whole program, but if the developer wants to get the execution timing of each line, line_profiler can be used. Therefore, from designated functions, it will provide the execution time for each and individual line. Whenever line_profiler is used in the program with any function, we need to write the decorator "@profile" before the function name to indicate that profiling needs to be done in this line.
Memory_profiler:
It is very useful for deriving the memory being used by every line of the Python program. The working of memory_profiler is the same as line_profiler. We have to use the decorator to define which line or the function we need to profile. By using it, developers can optimize the code so the program will take less memory at the time of execution. It is very good when the developers want to implement a program that might use less memory in the execution.
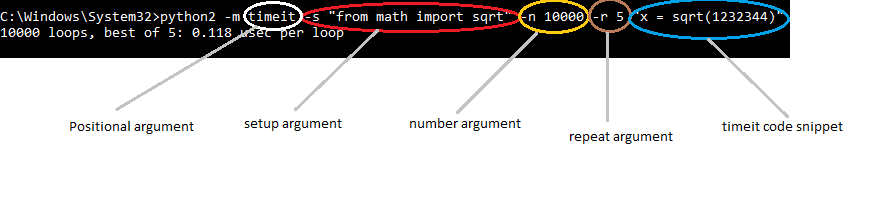
Time/Timeit:
It is helpful to find the execution timing of the Python code. There are two functions for time:
Time: This measures the time a specific function takes to execute. It can be used to find out which part of the code is getting executed at a slow pace. Sometimes, the output of this profiler doesn't show up clearly during the execution. This might be because the CPU was busy executing other system calls, so the timing that was shown by the profiler might be different.
Timeit: This works the same as the time function, but it executes the program a couple of times and then shows the average time that was taken in the execution of the program.
Pyinstrument:
Pyinstrument provides the report based on the execution time of the snippets. It can work on a whole program or a small piece of the program, but developers have to declare the profiler as an object where it exists.
Its working is the same as cProfile as it also checks the execution time of the whole program. But, in cases of a small piece of code, cProfiler is inefficient and can't work. Instead, Pyinstrument can work in that condition as well. It doesn't show the stats about every function, and that is why it generates less traffic than cProfile.
It only shows the stats about the top snippets. Developers can focus on those parts that are generating too much traffic.
It can not work well with those applications that are running in multiple threads.
cProfiler:
cProfiler is used to calculate the time spent in executing functions and how many times they have been called in the program. It shows a couple of different attributes that can be used to optimize the program, such as ncalls, totime, cumtime, etc. These show up all the time spent in the execution of main functions and subfunctions.
As it provides the execution time, the developer can easily identify those functions that take too much time in the execution, and after identification, they can be easily optimized.
You can pass a couple of different arguments to have a greater view of the execution timing and function calls.
-
-m: This can be passed if developers want to execute only a specific module
-
-o: You can provide an output file using this option. The file will contain the statistics about the program.
cProfiler sometimes creates too much noise and can take a lot of memory in the execution, but since it can be used on a specific module and on the whole program, it makes it possible for the developer to use that efficiently. But if you are running it for the whole program, you need to worry about the CPU utilization and the memory usage.
Py-spy:
It can be used with multithreaded and sub-processed Python applications. It can also work on profile C extensions, but that can be useful only when it is compiled with symbols.
It is very hard to run Py-spy in the production environment as it runs out of the process with the profiled program.
It creates samples of the program as "Pyinstrument", but at regular intervals, instead of recording every single call, its output generates a flame graph at the time of conclusion. The top command in it provides the live updates and interactive display of applications.
Due to that, developers cannot work on a particular function.
Yappi/Yet another Python Profiler:
It can take input stats from threads, so there is no need to decorate the thread code.
It is a default profiler in Python IDE, i.e., Pycharm. So if users use this IDE by default, they can see the "Yappi" profiler. Developers have to write the code with instructions to invoke, start, and stop. After that, they can fetch the report from there. It can also tell how much time an application is taking to execute the code using "CPU time" or "Wall time". CPU time provides more accurate results as compared to Wall time.
Conclusion
Until now, we discussed the necessity of profilers and some Python profilers available to developers. Every profiler has its own benefits, uses, and disadvantages. Developers have to pick any one as per their business needs and usage. But due to its usability and other things, we can easily say that gProfile has all the benefits and fits all the needs of the developer.
Comments (0)