
Photo by Carlos Muza on Unsplash
According to SlasData, Python has reached over 8.2 million developers and its popularity has surpassed Java. It was the second-fastest-growing language community according to research that was made in 2018. One of the main reasons behind Python's popularity is its simplicity; its syntax can be easily understood even by beginner developers who are just starting out.
Python is a popular programming language choice in the growing fields of data science and machine learning -- they also have very active communities. As a result, Python has become a common choice amongst those who deal with data visualization.
In this article, we're going to discuss how to debug data visualization programs.
Quick Overview of Debugging
As we know, debugging is what you do to remove errors from your code. Developers are always aware that debugging is a tricky job. Sometimes, working with the wrong data types (depending on your library or function), or adding or forgetting to add extra punctuation can create problems that take forever to find and resolve. If you do not give your full attention to your code while writing it, you will end up spending all your time debugging it.
Most devs start out by manually debugging their programs. At a higher level, there are debugging tools that can assist you in debugging. For this article, I'm going to demonstrate debugging via Lightrun Cloud which is a free real-time debugging tool. The reason I'm using it for this article is because it is beginner-friendly and well-suited for big data projects. It supports applications in JVM, Python, and Node.js.
Before demonstrating the debugging process, let's first conduct the data visualization development.
Data Visualization in PyCharm
We will be performing our data visualization by using PyCharm. For this example, I'm going to define a function that draws a line graph to show the immigration from Haiti to Canada between 1980 and 2010. You can use data visualization programs to showcase many forms of data.
 View Website
 View Website
 View Website

Output:

As you can see in the code, Lightrun has already been configured. This is a quick process.
Lightrun Configuration in PyCharm
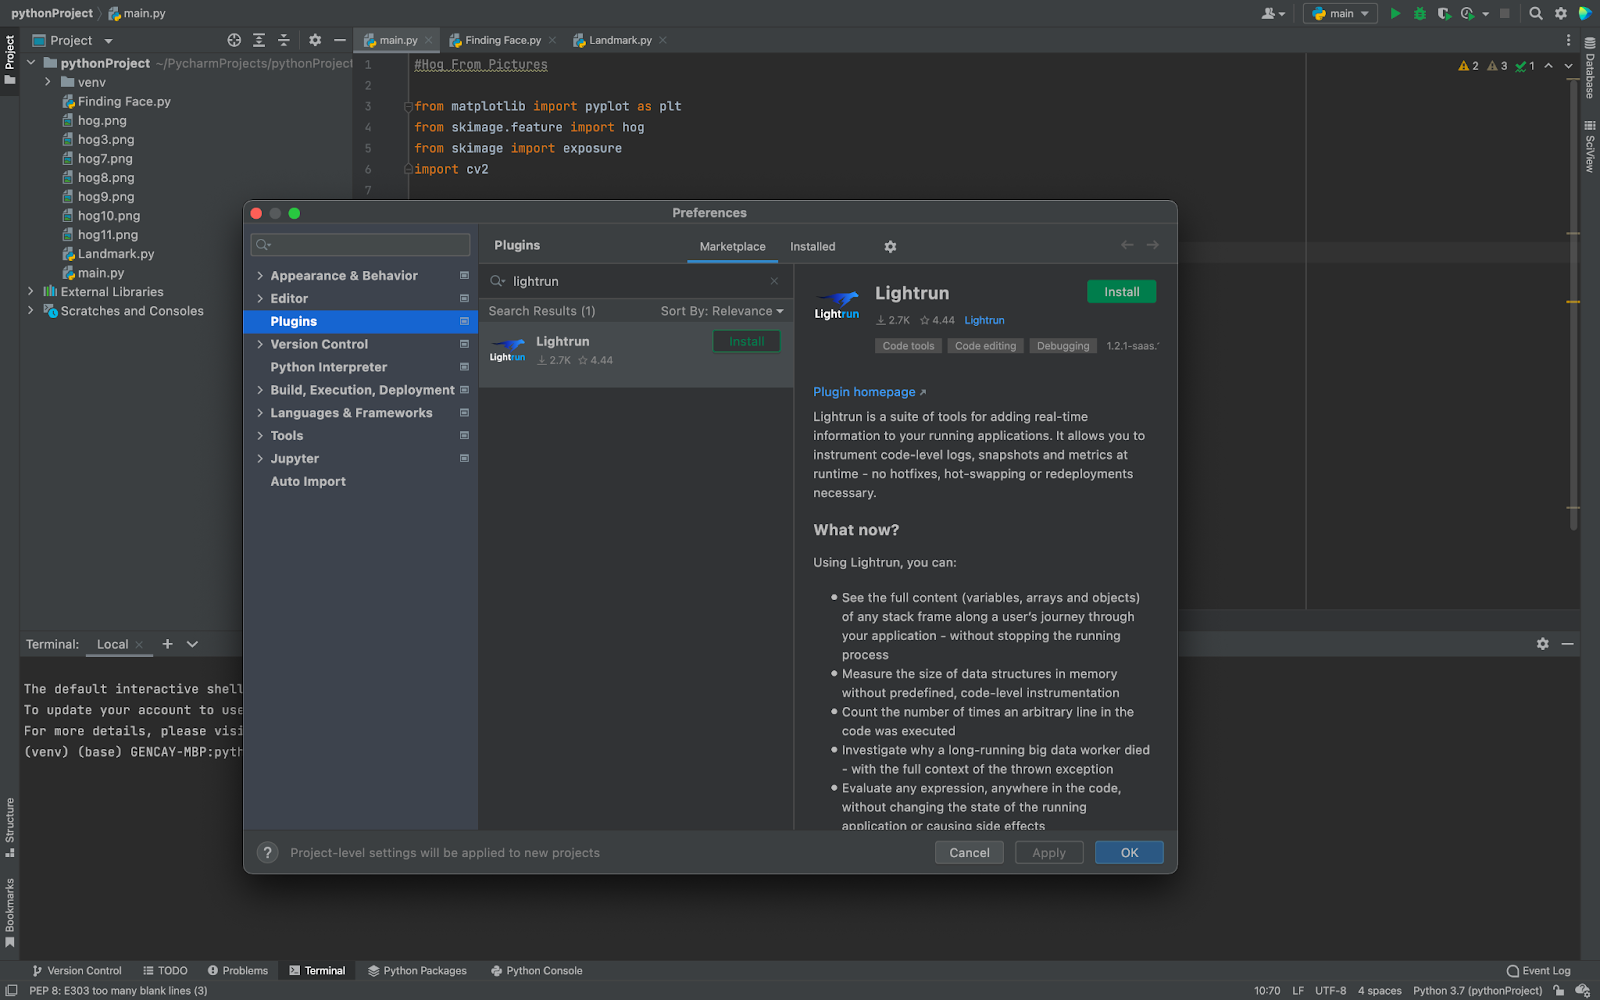
To configure Lightrun in Pycharm, go to your preferences panel. For me, the path is File > New Project Setup > Preferences for New Projects.

From here, click on Plugins under Editor. After that, select Lightrun and install it. It will take a little bit to finish the installation. Make sure you've already created your account and configured everything on Lightrun's end.
Afterward, PyCharm will suggest you restart your interpreter.
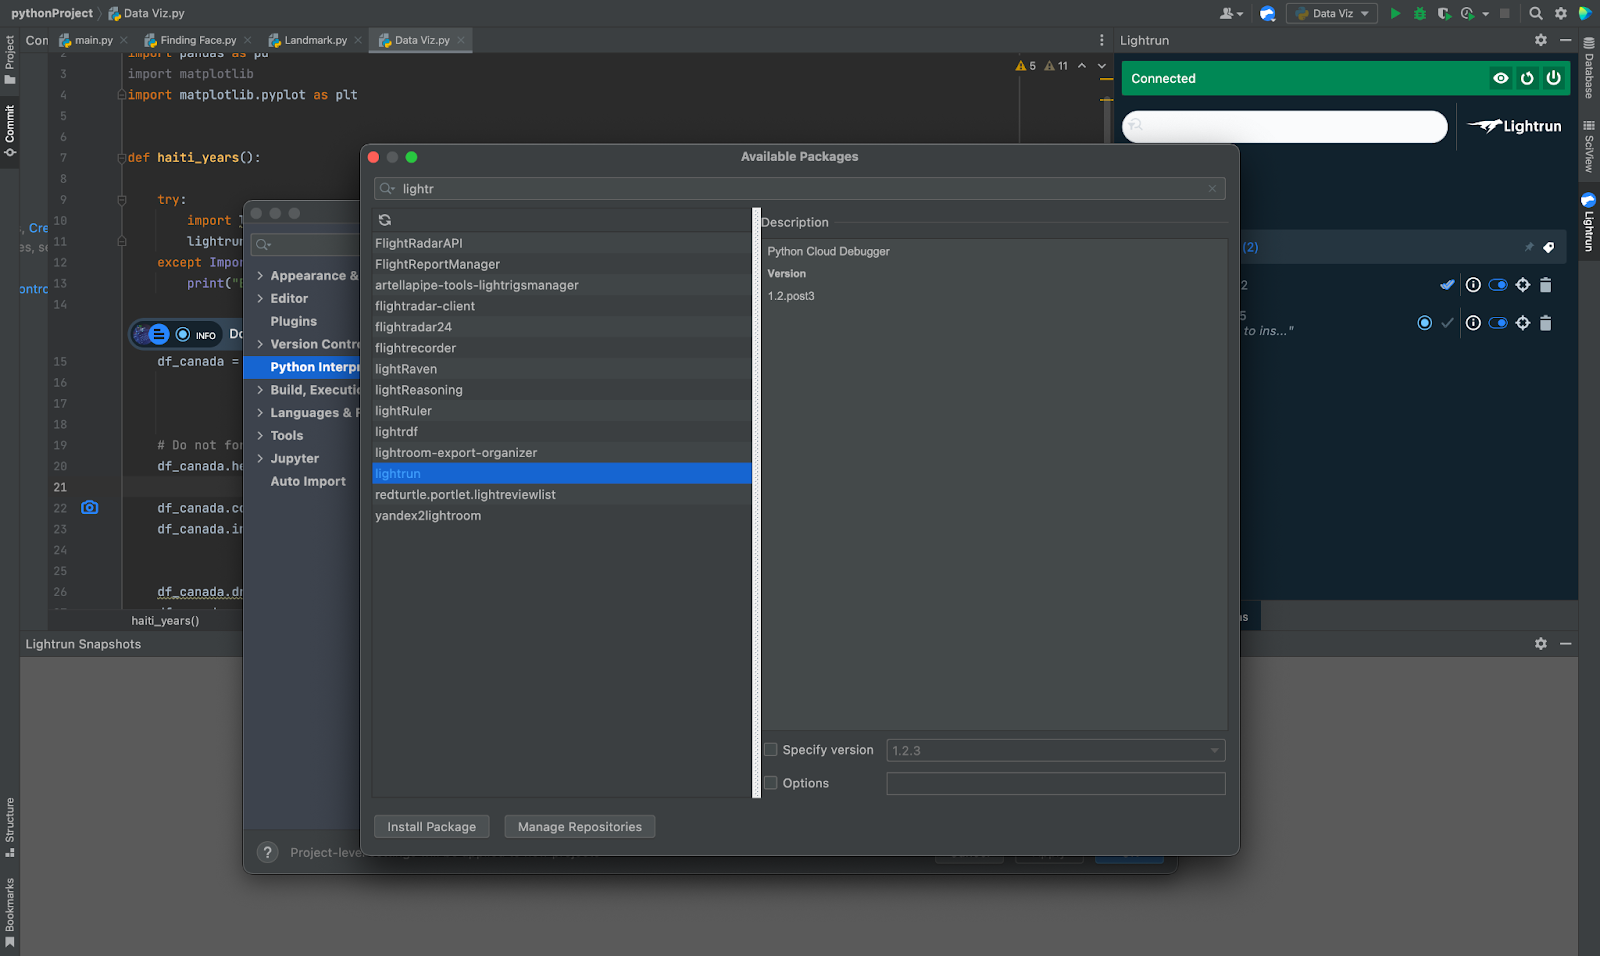
After setting up your plugin, it is now time to install your plugins library from here in Python. To do that, you can click on the plus sign, find Lightrun, and click on install package as follows.
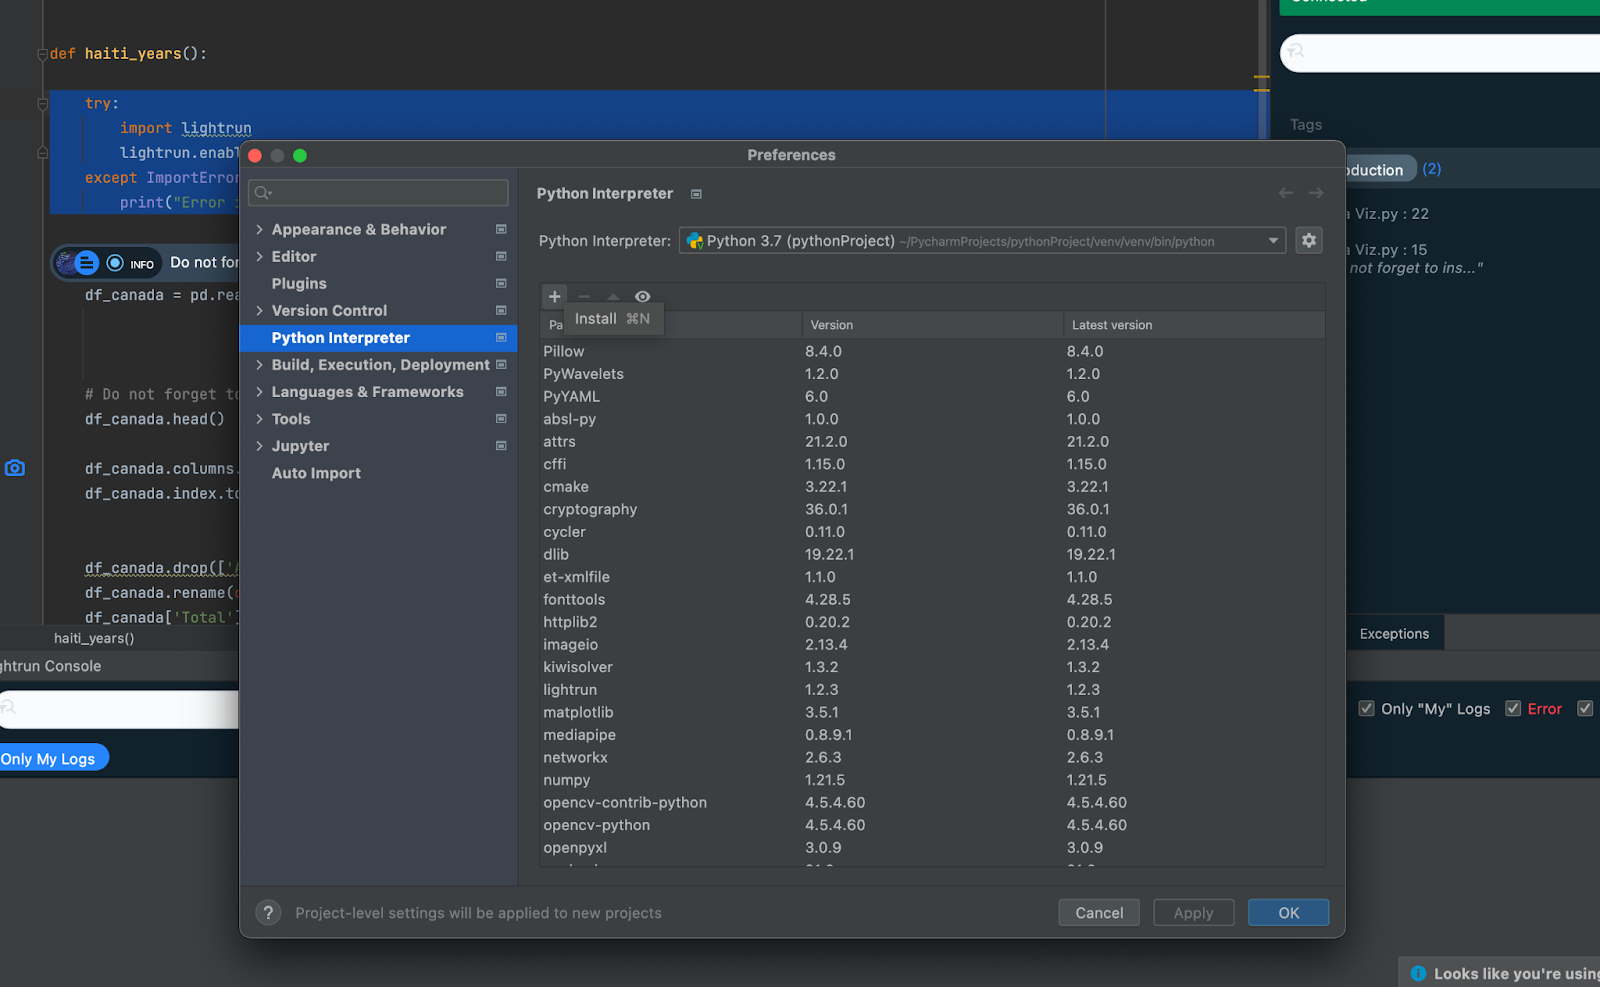
Alternatively, if you wish, you can use the terminal to install your library.
python -m pip install lightrun
This is the code that you will add every time you want to use Lightrun.
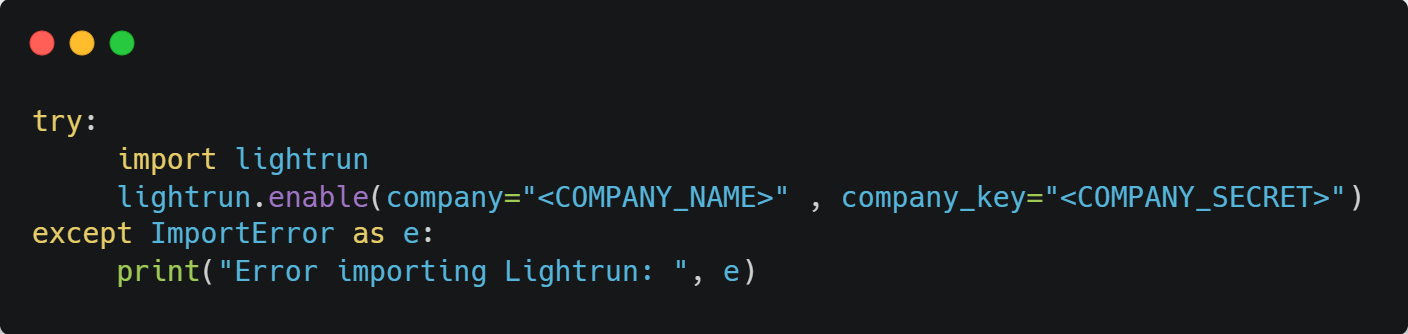
As an example, you can check this as well:

Getting Started with the Debugging Process
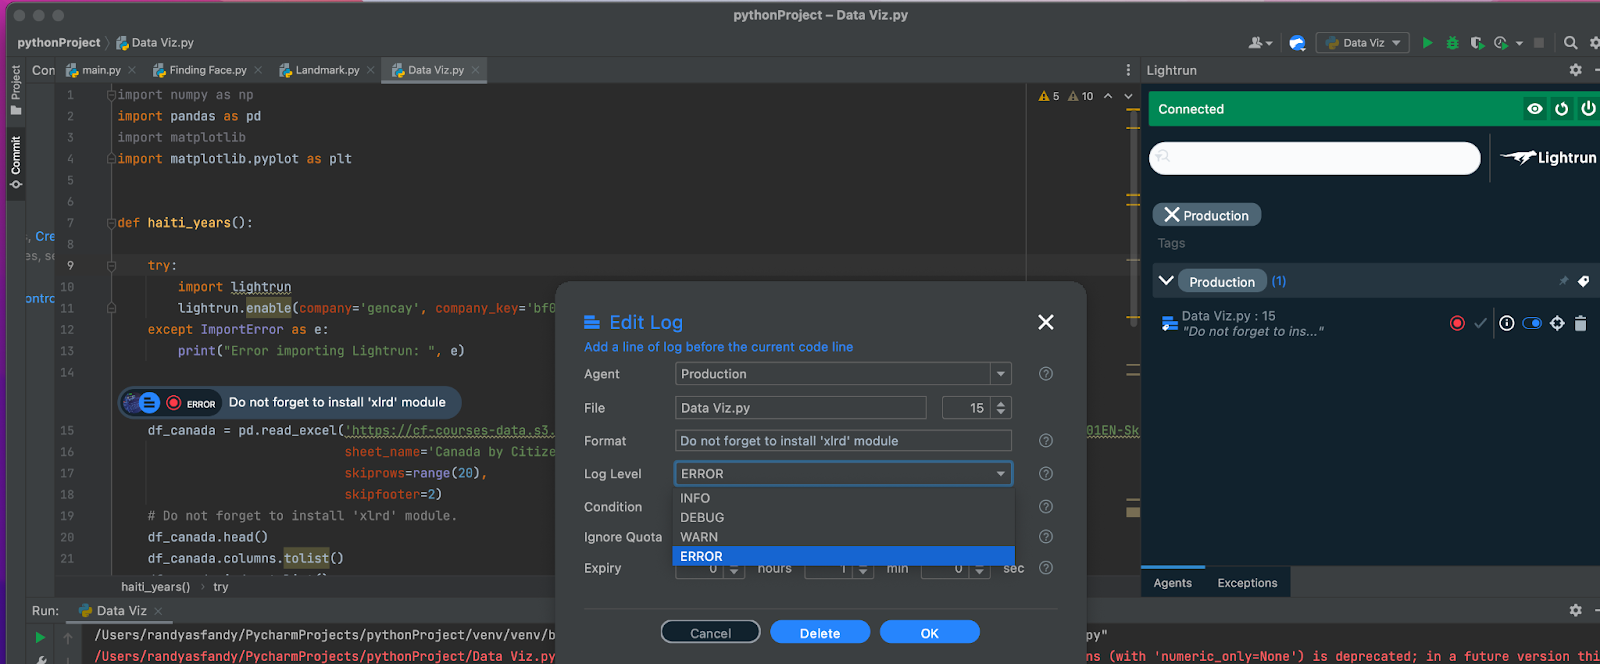
A good eye would catch that it is vital to install the 'xlrd' module for this program. Without that, you will get an error message. To remind yourself and other devs who may use this project, you should enter a log.
Logging
You can create logs within Lightrun to maintain a roadmap of critical information in your program. This can also preempt any severe debugging messes. Just right-click the highlighted code, click Lightrun, and then Log.

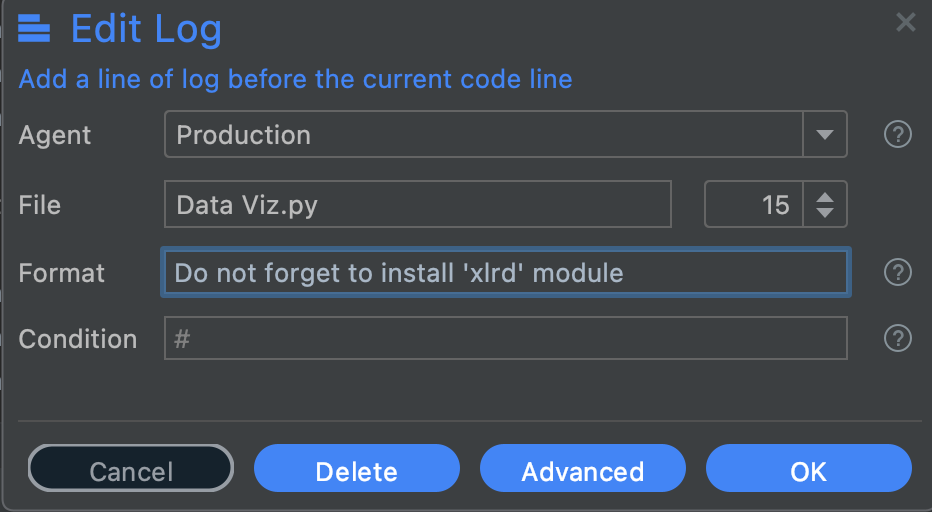
You can select the agent, file, format, and condition. To dive deeper (if you know what you're doing), click on advanced.
You can indicate log levels INFO-DEBUG-WARN and ERROR.
INFO-DEBUG-WARN is for general warnings, and will be indicated by a yellow circle.

The ERROR logs will be denoted by a red circle.
You can also set the time of your log.
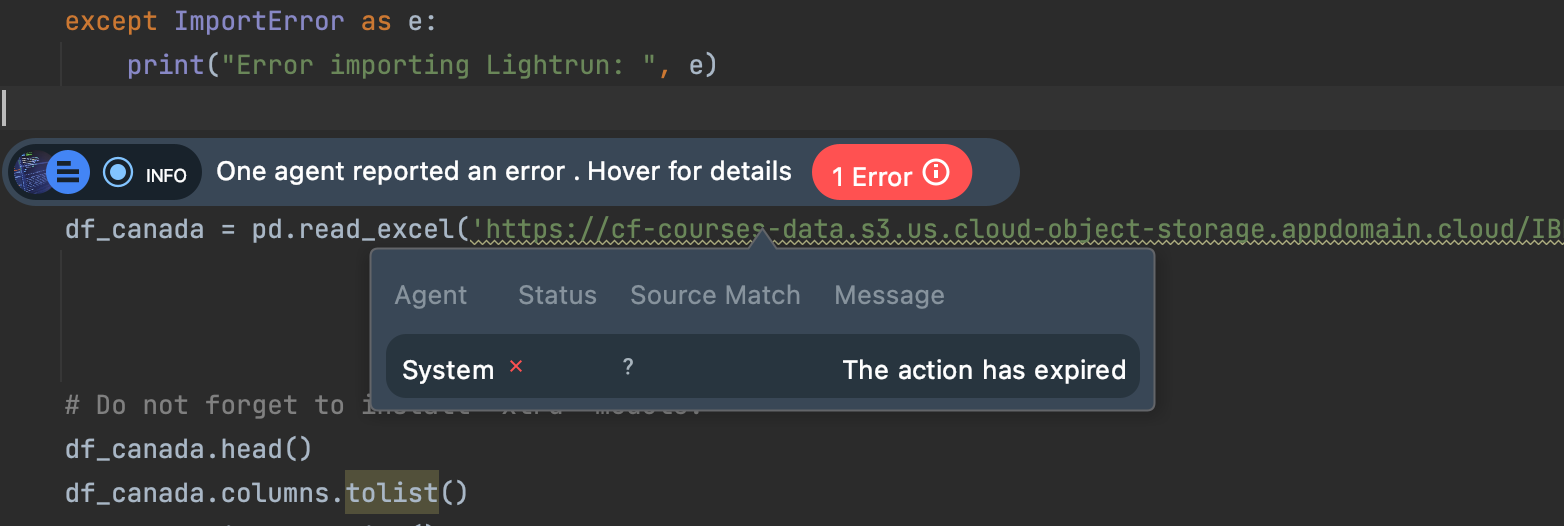
Timing Logs
This is a vital feature. Imagine you and your team have a project, and, like every project, it has an overdue time. By setting time to your problem in code, you are telling your team that the problem should be solved in 'n' hours or minutes. When creating a log, you can set the expiry time. Here, expiration seconds must be a minimum of 60 seconds.
After your time's up, you will also get an error like this:
Snapshots
It is easy to create snapshots via Lightrun as well. You can also save your variables into these snapshots.

After that, just right-click on the icon left, and you can edit or delete your snapshot.

Piping Configuration
To look at the output of your actions on various platforms, you have to click on the pipe.
The piping configuration gives you control of your actions in various platforms, which is app, plugin, and both.

App is the default setting; it will show all logs that exist. Plugin will show logs in the Lightrun Console at the bottom of the interpreter. If you select both, you will see all logs.
Conclusion
Nowadays there are several software developments that will make you more productive. Even if your programming language is easy to understand, sometimes because of many reasons you have to take care of your code.
When it comes to data visualization, there are several important actions that need to be done along the way. And it is vital to remind yourself or your colleagues to work with these actions to avoid debugging. In this article, we looked at how best to debug a data visualization program by utilizing a free real-time debugging tool.
Comments (0)