
In this tutorial we will dive a bit deeper into the docker-monitoring-stack-gpnc repository, on how to setup a docker monitoring stack that runs grafana, prometheus, node-exporter, cadvisor and alertmanager, which includes node and container level metric dashboards.
About
The repo has been built to get a monitoring stack up and running within seconds and the components includes:
- Grafana: For visualising graphs
- Prometheus: Timeseries Database for Metrics
- cAdvisor: Exposes Container Metrics
- Node-Exporter: Exposes Node Metrics
- Alertmanager: Manages Alerts
Setup
First clone the repository:
git clone https://github.com/ruanbekker/docker-monitoring-stack-gpnc
Then change into the directory:
cd docker-monitoring-stack-gpnc
You can inspect the docker-compose.yml file to view all the container's and it's configuration.
You will notice there's a Makefile so to view the targets run make:
help                           This help.
up                             Runs the containers in detached mode
clean                          Stops and removes all containers
logs                           View the logs from the containers
open                           Opens tabs in container
Boot
To boot the stack, we can use make up, but for this tutorial we will use the docker commands:
docker-compose up -d
Ensure all containers are running:
docker-compose ps
The output should looke like this:
 View Website
 View Website
 View Website
    Name                   Command                  State               Ports
--------------------------------------------------------------------------------------
cadvisor        /usr/bin/cadvisor -logtostderr   Up (healthy)   8080/tcp
grafana         /run.sh                          Up             0.0.0.0:3000->3000/tcp
node-exporter   /bin/node_exporter --path. ...   Up             9100/tcp
prometheus      /bin/prometheus --config.f ...   Up             0.0.0.0:9090->9090/tcp
alertmanager    /bin/alertmanager --config ...   Up             0.0.0.0:9093->9093/tcp
Access grafana on Grafana Home (or make open) and you should see the two dashboards that was provisioned:

Once you select the nodes dashboard, it should look something like this:

When you select "Alerting" and "Alert rules" you will find the recording and alerting rules:
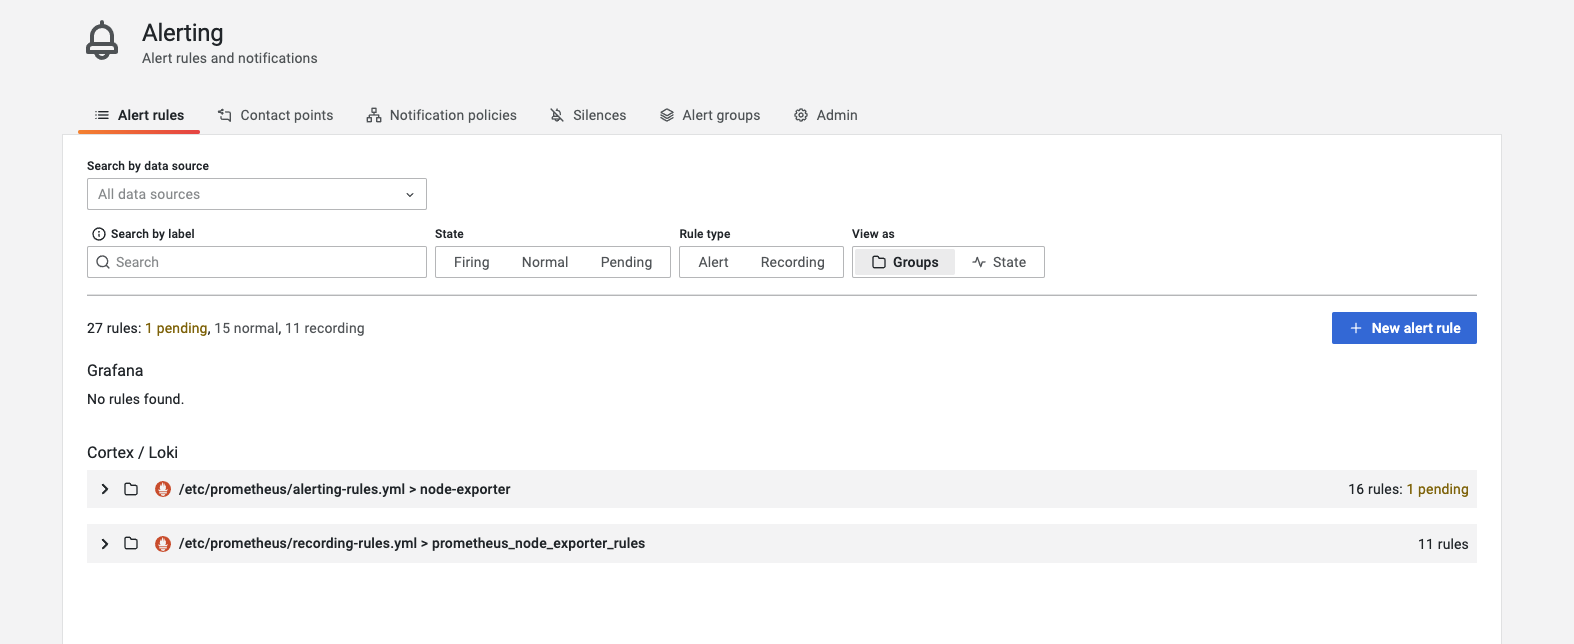
We can expand the alerting rules:

And then we can view more detail on a alert rule:

And for our container metrics we can access the Container Metrics dashboard:

Endpoints
The following endpoints are available:
| Container | Internal Endpoint | External Endpoint | | -------------- | ------------------------- |---------------------- | | Grafana | http://grafana:3000 | http://localhost:3000 | | Prometheus | http://prometheus:9090 | http://localhost:9090 | | Node-Exporter | http://node-exporter:9100 | http://localhost:9100 | | cAdvisor | http://cadvisor:8080 | N/A | | Alertmanager | http://alertmanager:9093 | http://localhost:9093 |
Cleanup
To remove the containers using docker compose (or make clean):
docker-compose down
Thank You
Thanks for reading, if you like the project, feel free to star, fork or share it, check out my website, read my newsletter or follow me at @ruanbekker on Twitter.
Comments (0)