
Introduction
This article will explore the most popular free pivot tables that can be added to your project, enhancing your web reporting capabilities. A pivot table is a universal tool that not only can organize and visualize data but also enable data sorting, filtering, and exporting. It can convert your data into a readable format and help you to get valuable insights. For developers, finding a suitable pivot grid library can be challenging. So I've checked different pivot control, and here is my review that can help you to choose the right web component.
List of best free pivot grid tools for data visualization
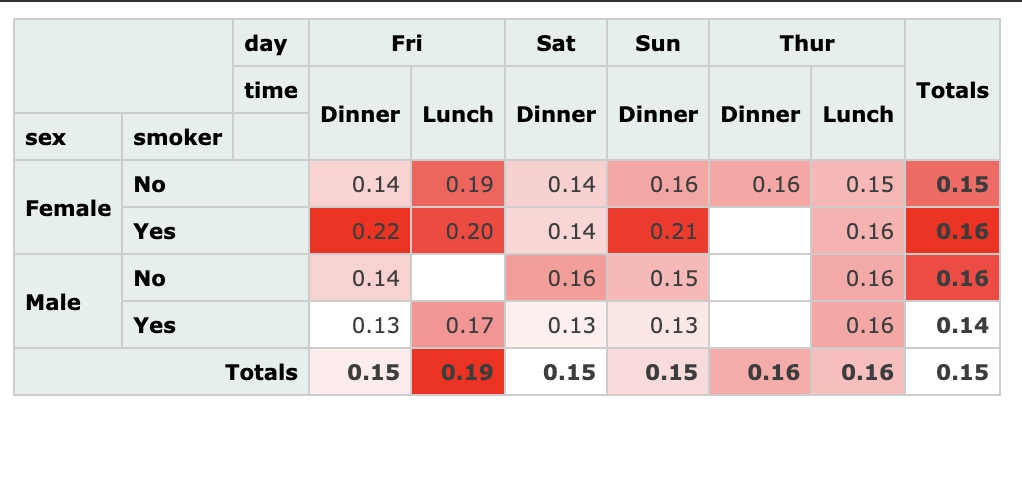
1 Pivottable.js
 Benefits:
- opensource
- ability to create custom pivot charts
- available localization
Cons:
- No updates & support since 2016
PivotTable.js is a great tool that provides users with the fundamental functionality of Excel pivot tables in a user-friendly manner. It was pretty popular among free libraries for some period. Developed initially in CoffeeScript, it is built on top of jQuery and jQueryUI. It is customizable, allowing developers to change the appearance using a custom color scale. Additionally, GitHub's localization files allow users to easily visualize their data and create reports in their preferred language or dialect.
PivotTable.js provides additional transformation pivot tables into pivot charts using special add-ons. If one has coding experience, the pivot table can be configured to meet their specific requirements. It may be a good choice for small projects, but it looks outdated, as it has not been supported for a long time.
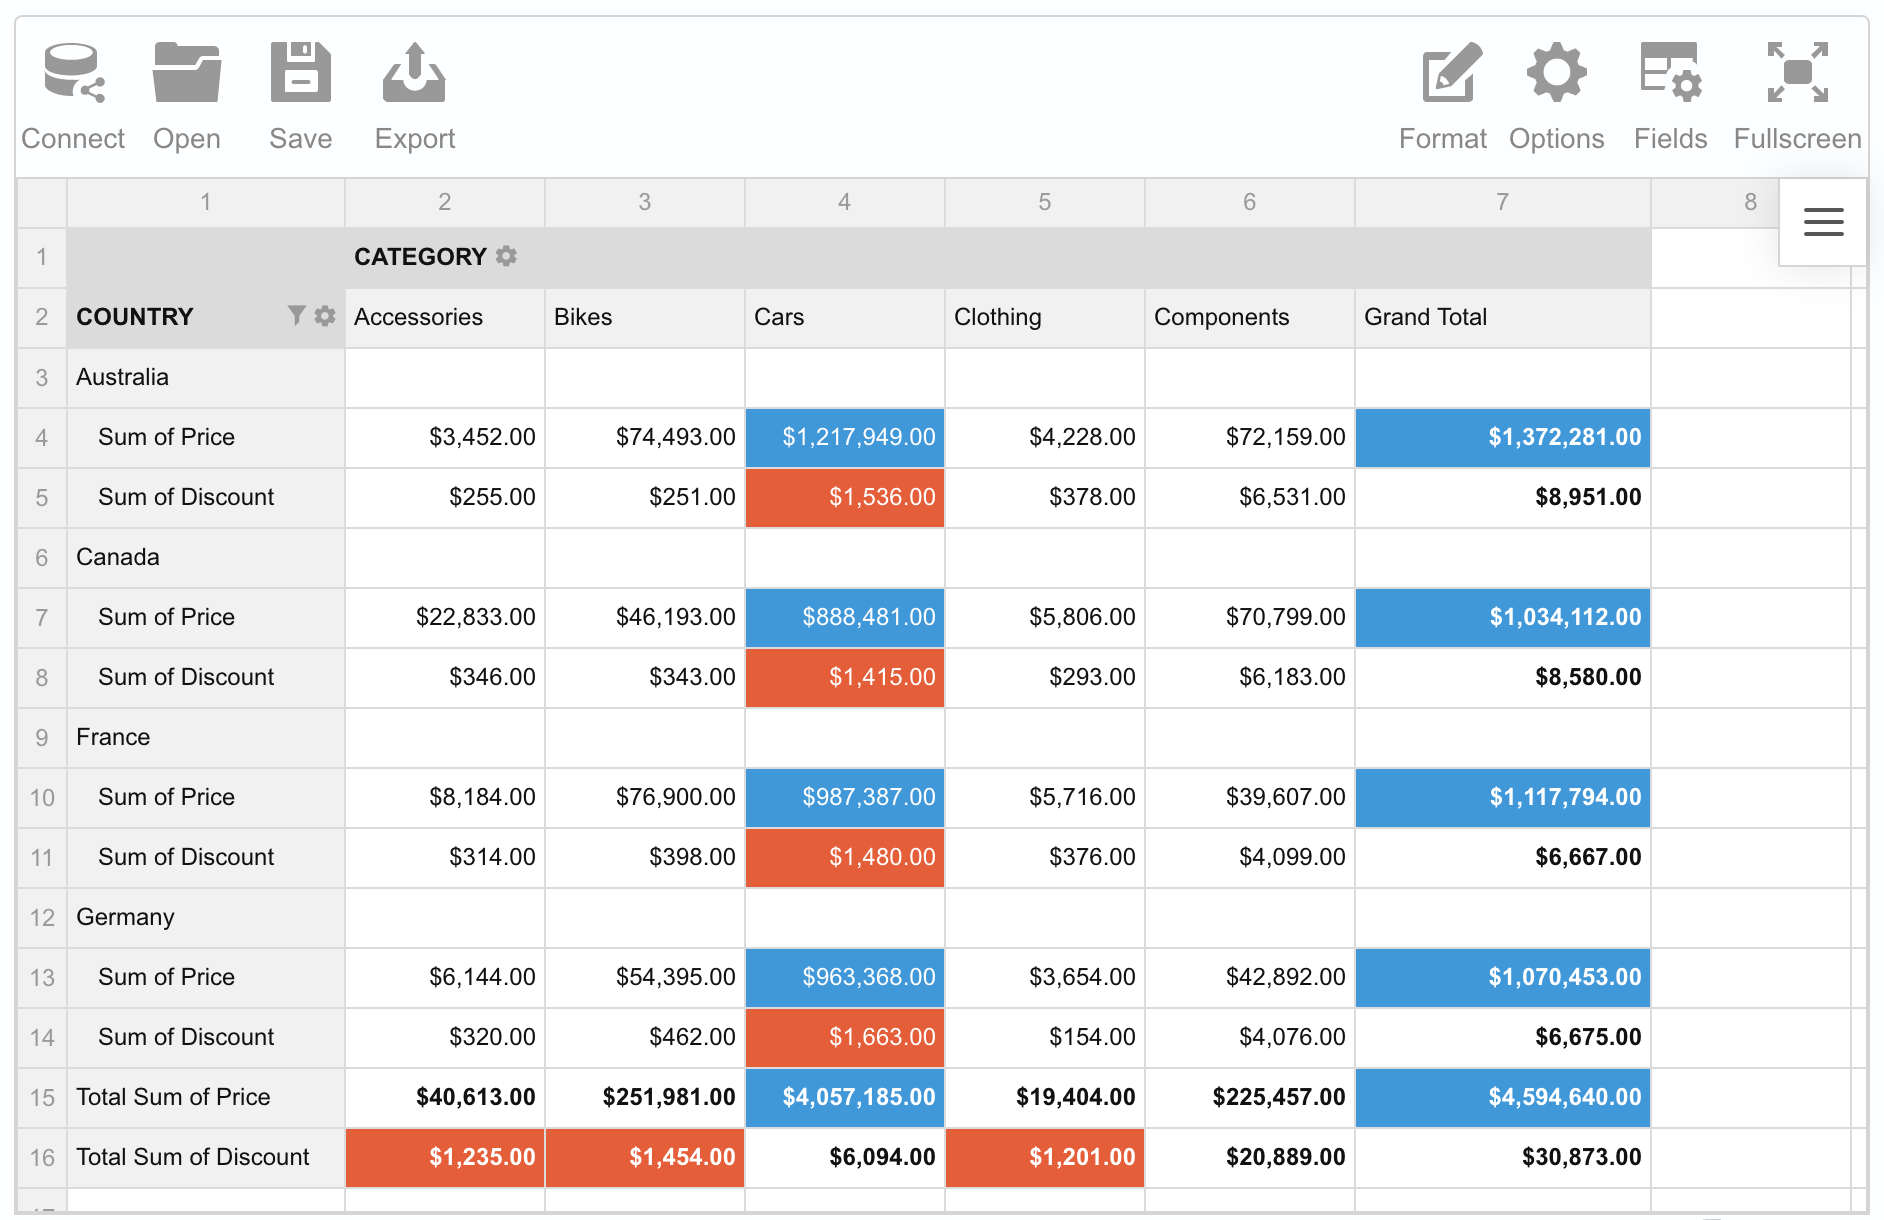
2 Webdatarocks Free Pivot table
 Benefits:
- Free
- Comfy Toolbar for users
- Integration with charting libraries
- Localization
- Customization options
Cons:
- 1MB data limit
WebDataRocks is actually one of the best free JavaScript pivot grid libraries available on the market today. Provides simple integration and complex data analysis. Natively written in JavaScript and presents data in CSV/JSON format in an interactive pivot table. It can also be integrated with Angular, React, and Vue, Blazor, making it an ideal choice for web developers. This tool allows users to easily explore and analyze their data, gaining valuable insights and making effective decisions.
 View Website
 View Website
 View Website
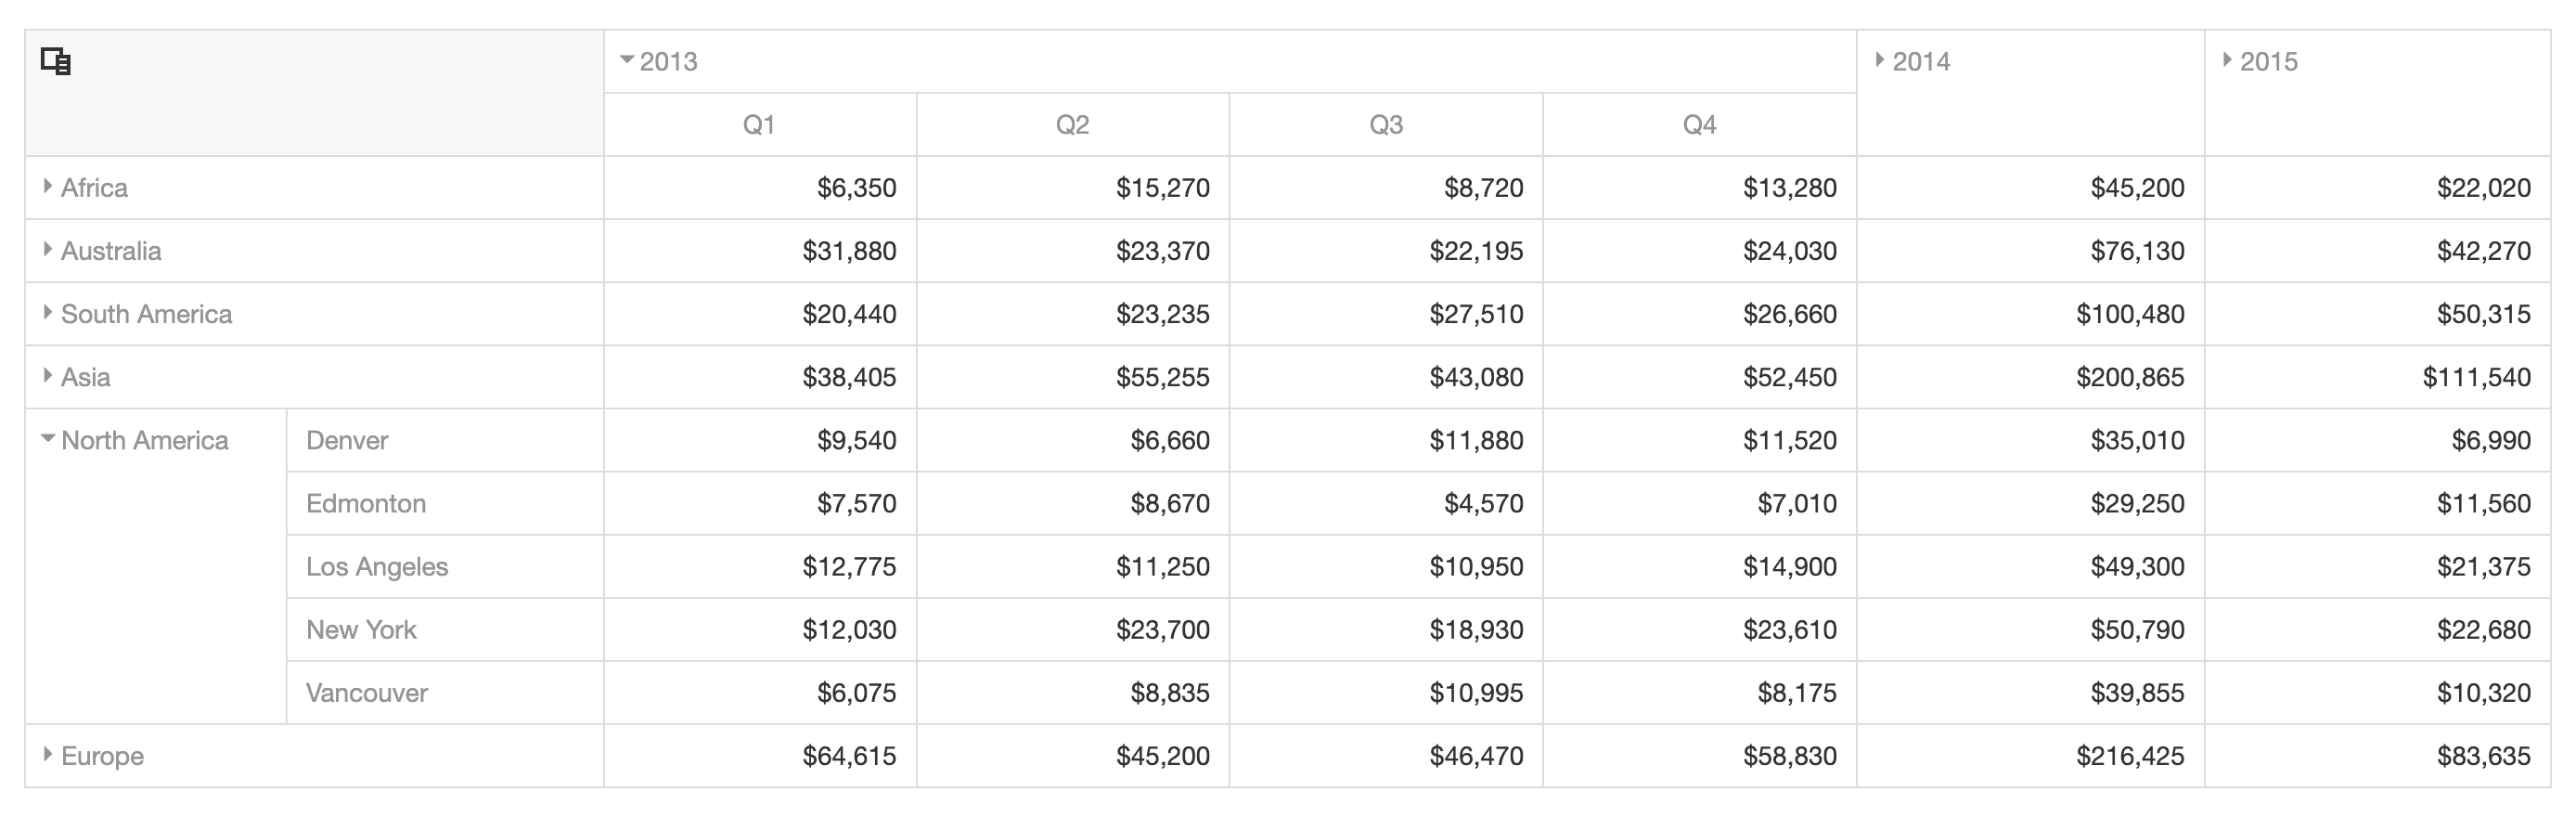
WebDataRocks Pivot has various data analysis features, making web reporting easier for users. All pivoting features are available: drag and drop, drill through, multiple data fields, grand totals, subtotals, sorting, filtering, and more.
The tool is designed to be user-friendly, allowing non-technical users to quickly and easily play with the data, create reports, and export results to Excel, PDF, and HTML formats. The pivot grid comes with a toolbar that assists users in slicing via the UI.
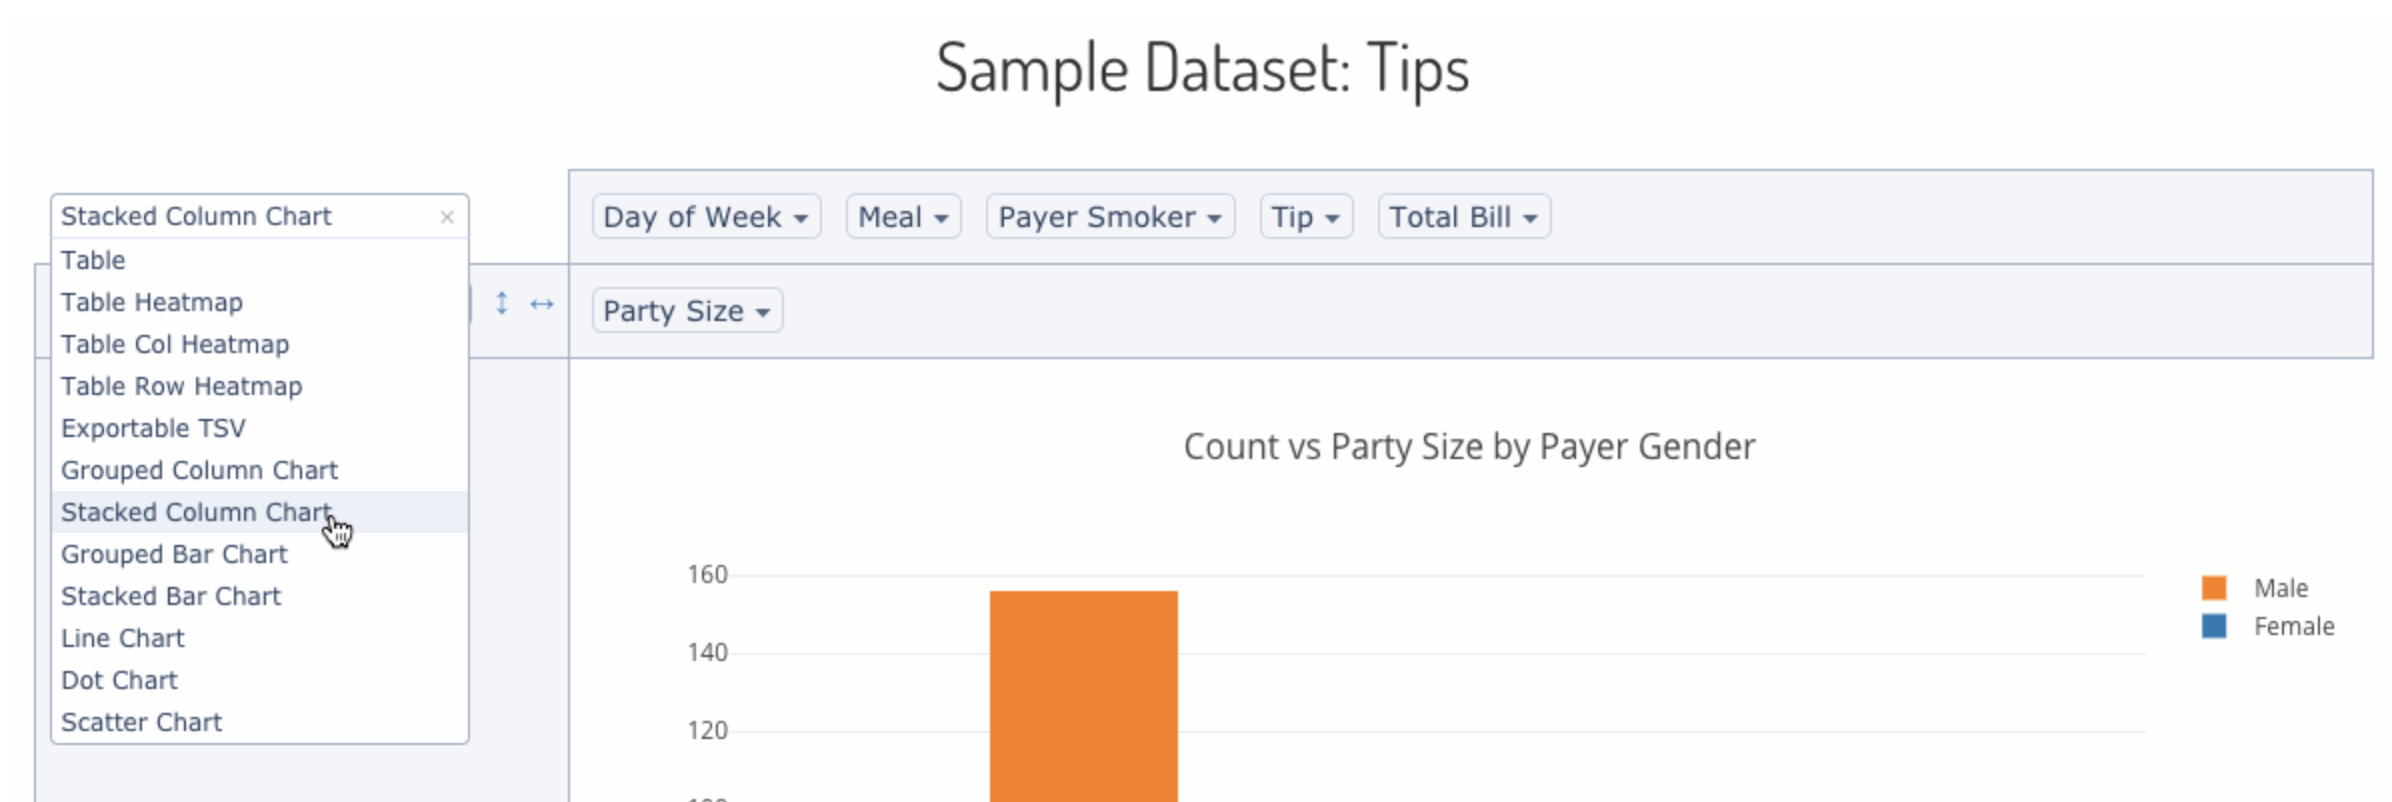
3 React-Pivot Table
 Benefits:
- supports React
- integrates with Plotly charts
- Open-source
Cons:
- for react only, not updated often
React-Pivot Table is a powerful tool for React lovers looking for an efficient and customizable way to create pivot grid apps with advanced functionality.
It's based on a popular pivottable.js (previously mentioned) but designed explicitly for React developers. It contains all the core pivot functionality that allows users to create pivot tables for reporting easily.
It also offers localization support and includes built-in table, heat map, and table-bar chart renderers. This allows users to customize and present their data in different ways.
4 Devextreme Pivot Grid
 Benefits:
- Connecting to OLAP
- Integration with charts
Cons:
- Free only for non-commercial usage
- Part of the component suite, so not updated constantly
Devextreme Pivot Grid is a tool designed for efficient multi-dimensional data analysis and offers support for binding to data from various sources and OLAP cubes (such as MS SQL Server Analysis Services).
The component is notably advanced in comparison with Pivottable.js or React-Pivot. Offers various key features such as summary calculation modes, customizable layout, data sorting and exporting, and integration with DevExtreme Chart.
In addition, it offers a rich set of customization options that allow end-users to arrange data in a proper way and make the user experience more effective.
Although Devextrem Ui Suite is a commercial product, there is a non-commercial free license for developers. It goes without update and support, but the pivot grid is already well-developed, so it's a nice option if you need a pivot for a non-commercial project.
Conclusion
The pivot table component is an incredibly powerful instrument that can enrich any web application, especially nowadays when the amount of data is only growing. The right pivot grid component can create sophisticated data visualization and help you with analysis.
It's hard to say what pivot component is the best, you should make decisions based on the needs of your project, but I hope this article was useful and will help you save time when choosing Pivot for your project.
Comments (2)